EKIP– Expert Club for Economics and Politics A Different Opinion
Over the past two weeks, Mark Zuckerberg has faced a lot of ridicule for his announced rebranding of Facebook into a new company called “Meta Platforms Incorporated”. The goal is to unify all the activities of the various businesses that are part of the Facebook group. In addition to Facebook itself, this includes other social networks such as “Instagram”, as well as the manufacturer of virtual reality glasses “Oculus”. It is the latter (virtual reality) that is being prioritized in the future development of Zuckerberg’s company, now known as “Meta Platforms”.
As is typical for the Facebook founder, his presentation was typically wooden, and quite a few memes and jokes were directed in that direction. Moreover, coming just weeks after a former company employee accused Facebook and Instagram algorithms of deliberately manipulating and even harming the psyche of users, the rebranding could be interpreted as an attempt to polish the company's image in a crisis. This is hardly the case, of course – such large-scale rebrandings have been planned for at least months and even years, and the shift in Facebook's focus towards virtual reality has been evident since at least 2020.
Beyond the wooden presentations and negative media coverage, objective financial analysis reveals that the shares of the now former Facebook and current Meta Platforms Inc. (still with the market ticker "FB") look like a particularly attractive investment. And for this reason, I bought shares of the company last week. In the following lines, I will explain why.
What do value ratios show?
The first indicators I will look at are value ratios. First, I start with the most commonly used indicator – the price-to-earnings ratio, or simply P/E. Then I move on to total enterprise value to EBITDA.
The data I use is based on earnings and EBITDA expectations over the next 12 months. I use data for the next 12 months because when investing we always look to the future. In addition, I try as much as possible to keep the analysis free from distortions caused by the pandemic situation over the past year and a half, which in many ways had a strongly positive effect on the revenues of many digital companies. The source of all data in this material is tikr.com.
Table 1: FB and Interactive Media and Services Sector Value Ratios
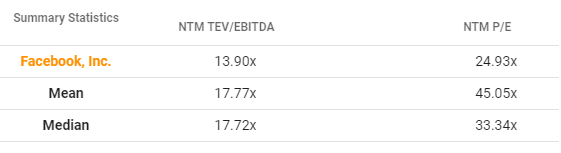
As we can see in the table above, Facebook has lower ratios than both the average and median values for the “interactive media and services” sector. The data I use here includes companies from all over the world. That is, even on a global level, Facebook’s two key valuation ratios – P/E and TEV/EBITDA – are lower than the average and median values for the sector in which the company operates. Let’s take a look at how it also performs against its largest competitors.
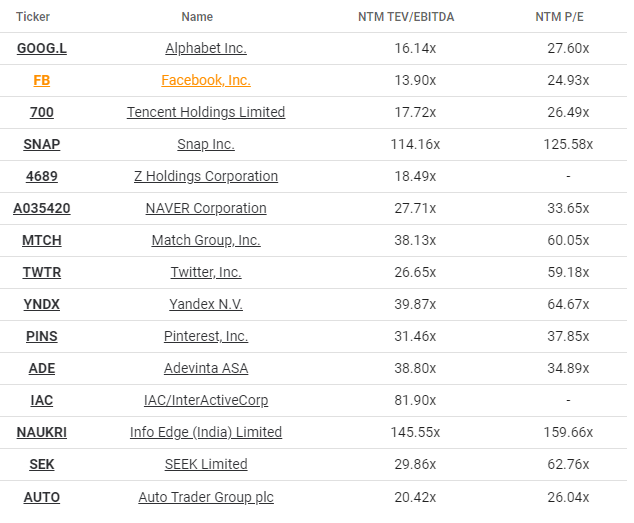
The table below shows the 15 companies with the largest market capitalization operating in the interactive media and services sector. Alphabet Inc. (Google) is in first place, followed by Facebook. Immediately after them are the Chinese conglomerate Tencent, Snap Inc. (Snapchat), and further down we see Match Group (Tinder, OkCupid), Twitter and Pinterest. Pay attention to the ratios. It is striking that Facebook's are among the lowest. Facebook has both the lowest TEV/EBITDA and the lowest P/E ratio of all 15 largest companies in the sector.
What do solvency and liquidity ratios show?
So far, it definitely looks like Facebook (now Meta Platforms) is an undervalued company within its sector. But maybe there is another explanation for these lower ratios. Maybe the company is heavily indebted, has problems paying its debts and suffers from low liquidity? To check this, we turn to 3 other key ratios. The first is debt to equity, which shows the ratio of a company's total debt to its equity. If it is above 1, it means that the company has more debt than it could currently cover with its equity.
For Facebook, this ratio is 0.1 for the 3rd quarter of this year, which is excellent. However, this ratio is an indicator of long-term solvency – what about short-term liquidity? That is why we pay attention to the current ratio, which relates short-term assets to short-term liabilities. An indicator of good liquidity is a ratio of at least 1.5, preferably above 2. For Facebook, it is 4.23 according to the latest data, which is also excellent. It seems that the company is in good financial health – the low value ratios are not due to indebtedness or lack of liquidity.
What do analysts calculate?
Since Facebook's ratios look so good, I dug deeper and calculated what its stock price should be based on a discounted cash flow model. The result for me was a price of $397 at a current price of $341. In other words, Facebook's stock is undervalued by over 16%. Of course, this is based on my calculations based on assumptions about the company's future cash flow growth, which may not turn out to be correct. Keep in mind, however, that I was trying to be conservative in my model, so it's more likely that I underestimated rather than overestimated the fair value of Facebook's stock.
If we look at the calculations of other analysts, they show similar values. The average price estimate for Facebook based on the calculations of 47 professional analysts is $403.7. The median price estimate is $415. In addition, 34 analysts believe that Facebook is a good buy at the moment and only 1 believes that it is better to sell. I should note, of course, that Wall Street analysts can often be very wrong in their forecasts. But it is still useful to pay attention to their estimates, at least as a reference.
Chart: FB EPS from 01.2017 to today
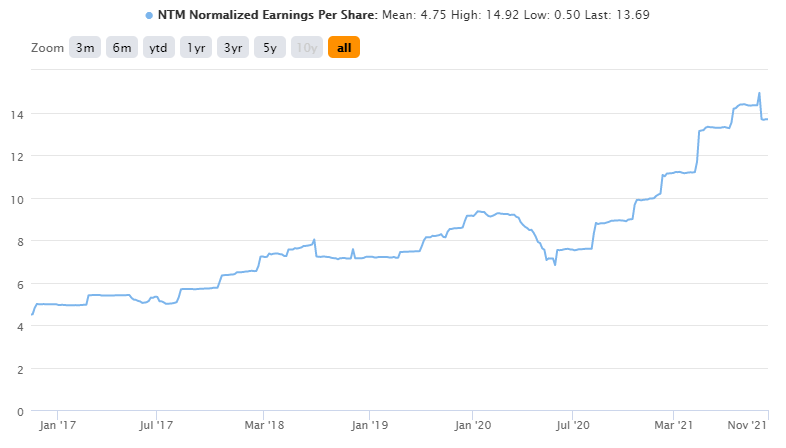
Finally, I also pay attention to the long-term trajectory of the net profit/share ratio (earnings per share). In the case of Facebook, the trajectory since its shares were listed on the stock exchange has been a long-term upward trend, with accelerated growth since mid-2020. From 2012 to 2020, EPS rose from $0.6 to nearly $10, and in 2021 it reached over $13. This growth is expected to continue next year. Overall, in financial terms, FB looks like a good investment. Low value ratios compared to the industry average, lower than most direct competitors, good liquidity and solvency indicators, and even a double-digit underestimation of value according to the discounted cash flow model.
What is the potential of virtual reality?
Finally, I would like to note that contrary to many skeptics, I think that Mark Zuckerberg's focus on virtual reality as a driving force for the social networks of the future is the right decision. There is some consumer bias on my part here, because I own one of the Oculus products myself and am generally quite happy with it. VR games are still a nascent genre and it will take time, but I think they can definitely become the mainstream form of gaming one day.
Sales figures for the Oculus Quest 2, the latest VR headset that was released last year, have been quite encouraging so far. In the last quarter of 2020, the Oculus Quest 2 set a new record for the number of virtual reality headset sales in a single quarter. Sales of over 1 million units globally were 9-10 times higher than sales of products from competitors such as Valve and PlayStation. A year later, the Oculus Quest 2 is the best-selling virtual reality headset ever produced by Oculus. The success of the Quest 2 has made Oculus (and consequently Meta) a leader in virtual reality in 2021 - the niche in which Zuckerberg intends to focus his company's efforts after the rebranding.
I think that virtual reality will penetrate more and more into all aspects of our lives, even beyond gaming. Social networks have already digitized our social lives to a huge extent, virtual reality is simply the next logical step in this direction. So, in my opinion, the news about the death of the Facebook/Meta business model is greatly exaggerated. In fact, the company still has the potential to grow into more and more areas of our lives, for better or worse. As investors, we can at least take advantage of this.