EKIP– Expert Club for Economics and Politics A Different Opinion
Game of poor and rich
"Nations sometimes do indeed succeed in adopting efficient institutions and achieving prosperity, but alas, these are rare cases."
Acemoglu and Robinson (2012) [1]
The rich-poor contrast has always been a leading topic for many, and elevating it to the level of countries is a particularly spicy problem from an economic point of view. History provides a number of examples of poor countries that have experienced a long period of economic growth and gradually entered the group of developed economies. Perhaps this is why there is a general understanding that poor countries should close the gap with the rich over time, or this is the so-called catch-up effect. Contrary to expectations, this is far from the main trend over the past 50 years, and the most interesting thing is that there is no one-sided explanation for this phenomenon in the economic literature.
Are poor countries lagging behind developed economies?
The so-called “growth miracles” have shown that it is quite possible for a poor country to reach the group of developed economies within a few decades, despite the many limitations and problems it initially faces. Examples of such economic miracles are the extraordinary expansion of the Asian tigers (Singapore, Hong Kong, etc.), the new course of governance in Chile, Ireland becoming a haven for foreign investment, and others. The development models that these countries have implemented differ, but their experience shows that, given the political will, prosperity is a completely achievable goal.
And although similar examples of rapid economic growth have been intensively studied and their development models have been applied in other countries, economic miracles are more the exception than the reality. There remains a large number of poor countries that continue to lag behind developed economies or, at best, maintain their distance.
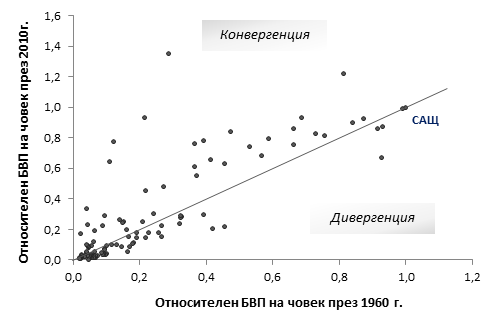
In this article, we will examine the progress of 106 countries (for which data are available) in 1960-2010 relative to the leader at the beginning of the period – the USA. To take into account the level of economic development, we will use the GDP per capita for each country as an indicator, presented as a percentage of that of the USA. For example, Ireland managed to significantly shorten the distance to the USA during these 50 years, as the GDP per person in this country rose from 47% of that of the USA in 1960 to as much as 84.4% in 2010. However, such a rate of convergence (convergence between the level of development between individual countries) is extremely rare (Figure 1). The further and above the 45-degree line a country is located, the stronger the convergence to the USA.
Chart 1. Relative GDP per capita (1960 vs. 2010)
GDP per capita for each country is presented as a share of that of the United States.
Source: Penn World Tables v7.1, own calculations, Jones (1997) [2]
Table 1 shows that less than half of the countries considered (44%) report higher growth than that of the United States. In other words, we observe a divergence rather than a convergence between the poor and the leader. Moreover, only 25% of the countries register sufficiently high growth rates (above 3%) to significantly close the gap with the United States. In fact, if a country was at 20% of the income of the United States in 1960 and grows by an average of 4% per year, then in 50 years that country will manage to reach only 50% of the GDP per capita of the United States. To catch up with the United States, growth of the order of 5.5% per year will be necessary, which in itself is an extraordinary achievement – only 4 countries managed to achieve such growth in 1960-2010.
Table 1. Income dynamics among countries around the world
"y" refers to GDP per capita as a percentage of US GDP per capita in 1960.
Moderate growth is defined as a 1 percentage point deviation from the average annual growth rate in the United States for the period, which is 1.96%. Therefore, growth below 0.96% is considered weak, and growth above 2.96% is considered rapid.
Number of countries |
Growth (%) | ||||
Fast |
Moderate |
Weak |
Faster than the US | ||
| All countries | 106 |
25 |
50 |
25 |
44 |
| y <= 5% | 27 |
26 |
44 |
30 |
41 |
| 5% < y <= 10% | 23 |
22 |
22 |
57 |
22 |
| 10% < y <= 20% | 16 |
31 |
50 |
19 |
38 |
| 20% < y <= 30% | 20 |
35 |
60 |
5 |
50 |
| 40% < y <= 40% | 13 |
15 |
69 |
15 |
85 |
| y > 80% | 7 |
0 |
100 |
0 |
57 |
Source: Penn World Tables v7.1, own calculations, Jones (1997)
Moreover, the gap is most visible among the poorest, whose GDP per capita was 10% or less of that of the United States in 1960. Less than a third of these countries are growing faster than the United States, and only a quarter have grown fast enough to show any noticeable improvement. The average results for these countries show that over these 50 years, progress relative to the United States has been negligible, within the margin of error.
Once outside this group, the chances of low growth decline dramatically, and the prospects for convergence are much more optimistic. Countries with relative incomes above 10% in 1960 have grown significantly faster than poorer economies, and most have caught up with the United States. The highest chances of rapid growth are found among countries with relative incomes between 20% and 40% of the United States in 1960.
The question is what prevents the poorest, where the growth potential is highest, from catching up with advanced economies. In fact, there are various hypotheses trying to answer this question.
Why are the poor unable to catch up with the rich?
Some economists argue that inequality between countries is due to geographical or natural differences. [3] For example, the climate in the tropics negatively affects technological development in agriculture, which, in addition to the wider spread of diseases, has historically slowed the development of countries at these latitudes. [4] Other authors consider the fact that the colonial legacy can largely explain the differences in incomes around the world. [5] There are also other hypotheses, such as the cultural hypothesis, which assumes that in some countries cultural understandings hinder the growth of labor productivity, and the ignorance hypothesis, according to which the political elite in underdeveloped economies does not have the necessary knowledge to implement the necessary policies.
All these hypotheses, although they carry a certain amount of truth, fail to fully explain the problem of the poor lagging behind the rich. The real reason is the constant, constantly recurring failure of poor economies to carry out the right reforms, both politically and in purely economic terms. The reason lies in the distorted incentives of the political elite in these countries. Opening the economy, eliminating the bureaucratic burden and reducing the inefficiency of the state sector in the most general case means a loss of power for politicians. The loss of power, in turn, leads to a loss of benefits for civil servants. Good examples around the world have clearly outlined the right path, and it certainly does not go through repression, limiting property rights and stifling the economy. Building the right institutional environment and incentives in the economy inevitably leads to rapid growth rates in the long run. The fact that there are so few good examples around the world over the last 50 years shows that this is a rather distant goal for the political elite in the developing world and... in our country.
[1] Acemoglu, D. and Robinson, J. (2012). “Why Nations Fail”, pp. 86-86
[2] Jones, C. (1997). “On the Evolution of the World Income Distribution”, Journal of Economic Perspectives, Vol. 11, N. 3: 19-36
[3] Diamond, J. (1999). “Guns, Germs and Steel: The Fates of Human Societies”
[4] Sachs, J. (2001). “Tropical Underdevelopment”, NBER Working Paper 8119
[5] Acemoglu, D., Johnos, S. and Robinson, A. (2001). “The Colonial Origins of Comparative Development: An Empirical Investigation”, The American Economic Review, Volc 91, No. 5: 1369-1401