EKIP– Expert Club for Economics and Politics A Different Opinion
Idea and methodological note
The purpose of this analysis is to examine inflation trends of products that make up the traditional festive table in Bulgaria for Christmas Eve and Christmas. The data used provide an insight into price movements in various food and beverage categories that are an integral part of the festive atmosphere.
The methodology is based on an unweighted index, including 18 food product categories. The data are collected from two sources: the website foodprice.bg of the Ministry of Economy, updated as of December 4, 2024, and the Consumer Price Index (CPI) of the National Statistical Institute (NSI), updated as of November 2024. The CPI uses data for beverages that are missing from foodprice.bg, specifically the categories “mineral waters, soft drinks and juices” and “wines”. The choice of the two sources is dictated by the need to gather a complete picture of the prices of all important components of the festive table.
To eliminate the risk of subjective distortion of the picture, we chose to make the index unweighted. Although at least every festive table on Christmas Eve and Christmas Day certainly includes a significant part of the selected products, or even all of them, the approximate proportion is not clear. The data necessary to be able to fix approximately statistically accurate weights are not available, which is why we preferred not to burden the analysis with the subjective judgments of the authors.
General price trends
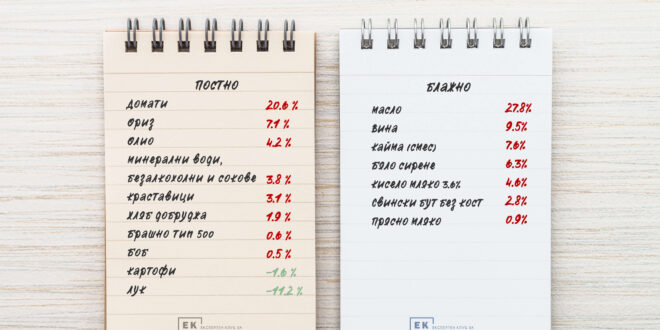
The analysis of the general unweighted index, including all 18 product categories (lean and indulgent foods and beverages), shows that on an annual basis the price of the Christmas table increases by 4.70%. This increase is significantly higher than the annual growth in consumer prices reported by the NSI in November – 2.1%. In addition, it is also slightly higher than the increase reported by the NSI specifically in the food category in November, which is 4.14% annualized. This shows that although inflation has significantly slowed down from the levels reported in 2022 and 2023, it remains relatively high and tangible specifically when it comes to the holiday table.

Among the products with the most significant price increases are butter with an increase of 27.82% and tomatoes with an increase of 20.57%. Excluding the influence of these two categories, which reported double-digit growth, the overall inflation of the Christmas Index is 2.27% on an annual basis. Inflation above the general level is also reported for minced meat (mixture), wines, white cheese and rice, but in relatively more moderate frames, always below 10% on an annual basis. Conversely, three categories recorded a decrease in prices - eggs (size M), onions and potatoes. The most significant is the decrease in the price per kilogram of onions - 11.16% on an annual basis as of 4.12.2024.
Movement in prices of lean foods
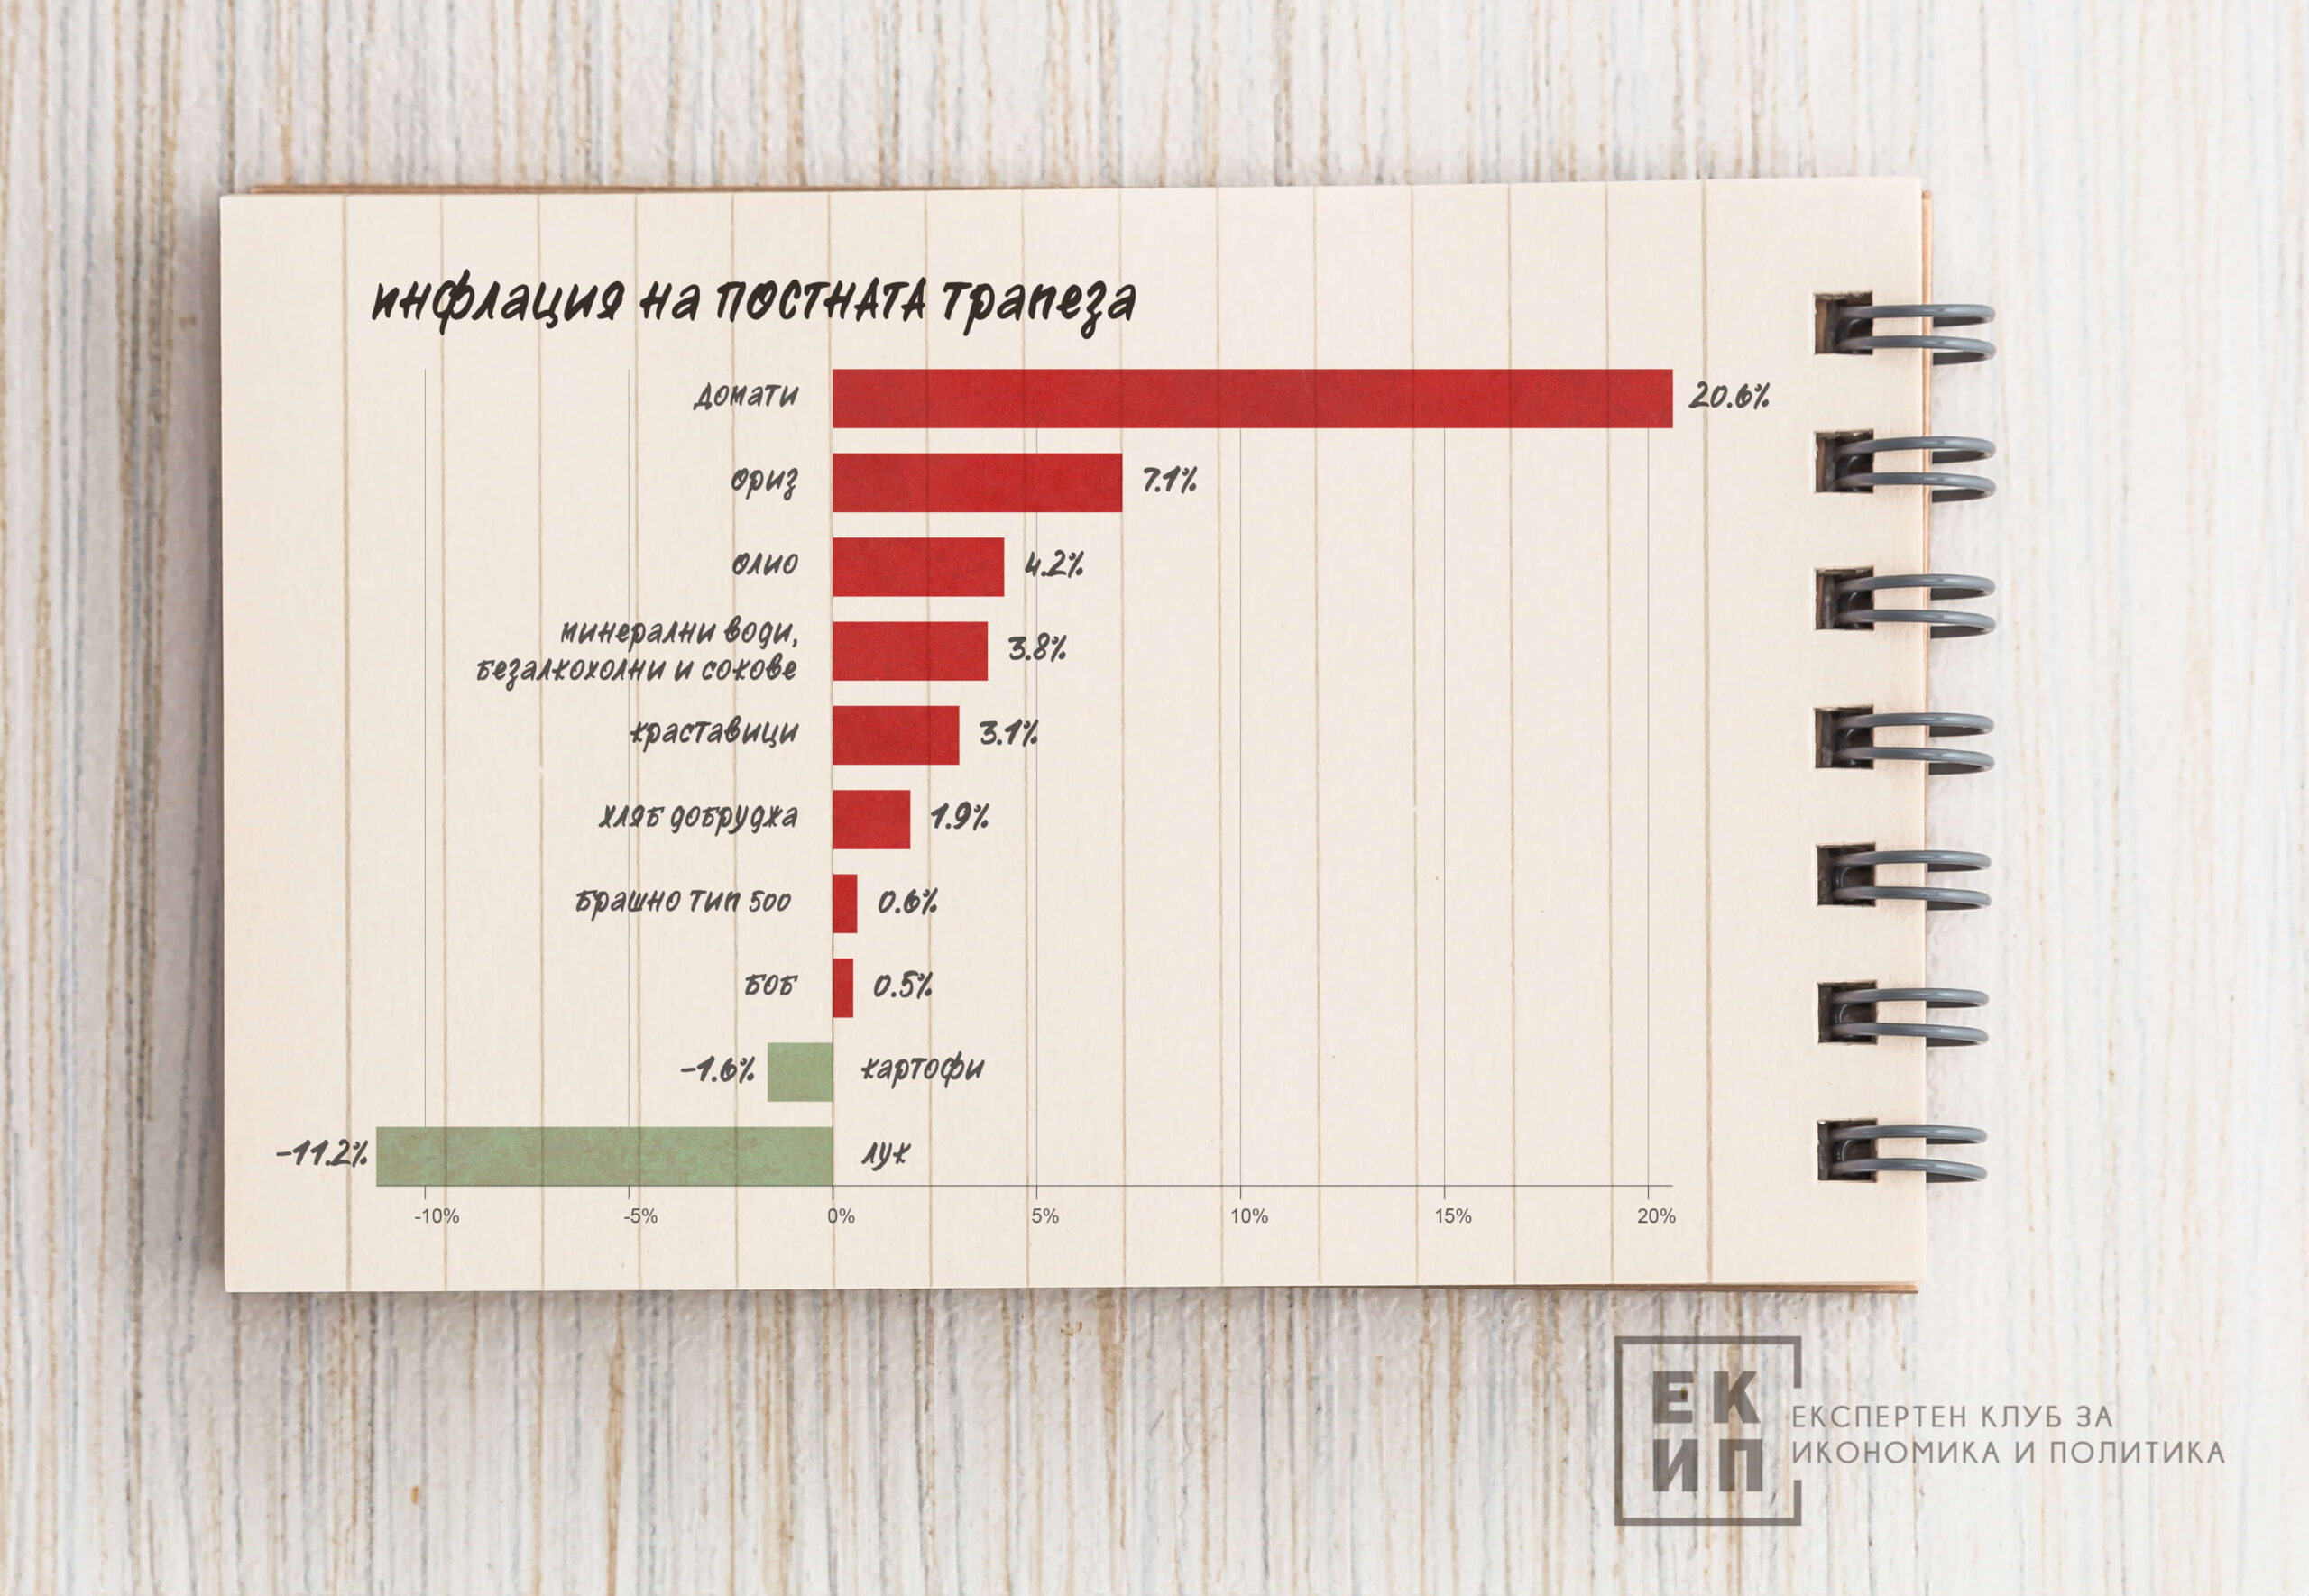
Lenten foods, important for Christmas Eve, have seen a lower price increase with an overall inflation of 2.91%. Although lower than the inflation in the overall Christmas Index, this level is also higher than the overall consumer inflation reported by the NSI. Among lean products, the highest inflation was reported for tomatoes, as we have already noted, followed by rice (7.11%), oil (4.2%) and the category of mineral waters, soft drinks and juices (3.82%). There was a decrease in prices in two lean categories – onions and potatoes. In the latter, the price decrease was weak – 1.62% on an annual basis. Overall, for the 10 lean food products, we notice a relatively lower inflation of below 4%, with the exception of tomatoes, rice and oil.
Price movements of convenience foods
On the other hand, for the indulgent foods that occupy a central place on the Christmas table itself, we find shockingly high levels of inflation. The total increase in the unweighted index of indulgent food products (8 in number) is 6.95% on an annual basis – significantly above the increase reported in both the overall Christmas index and the increase in the CPI reported by the NSI for November.
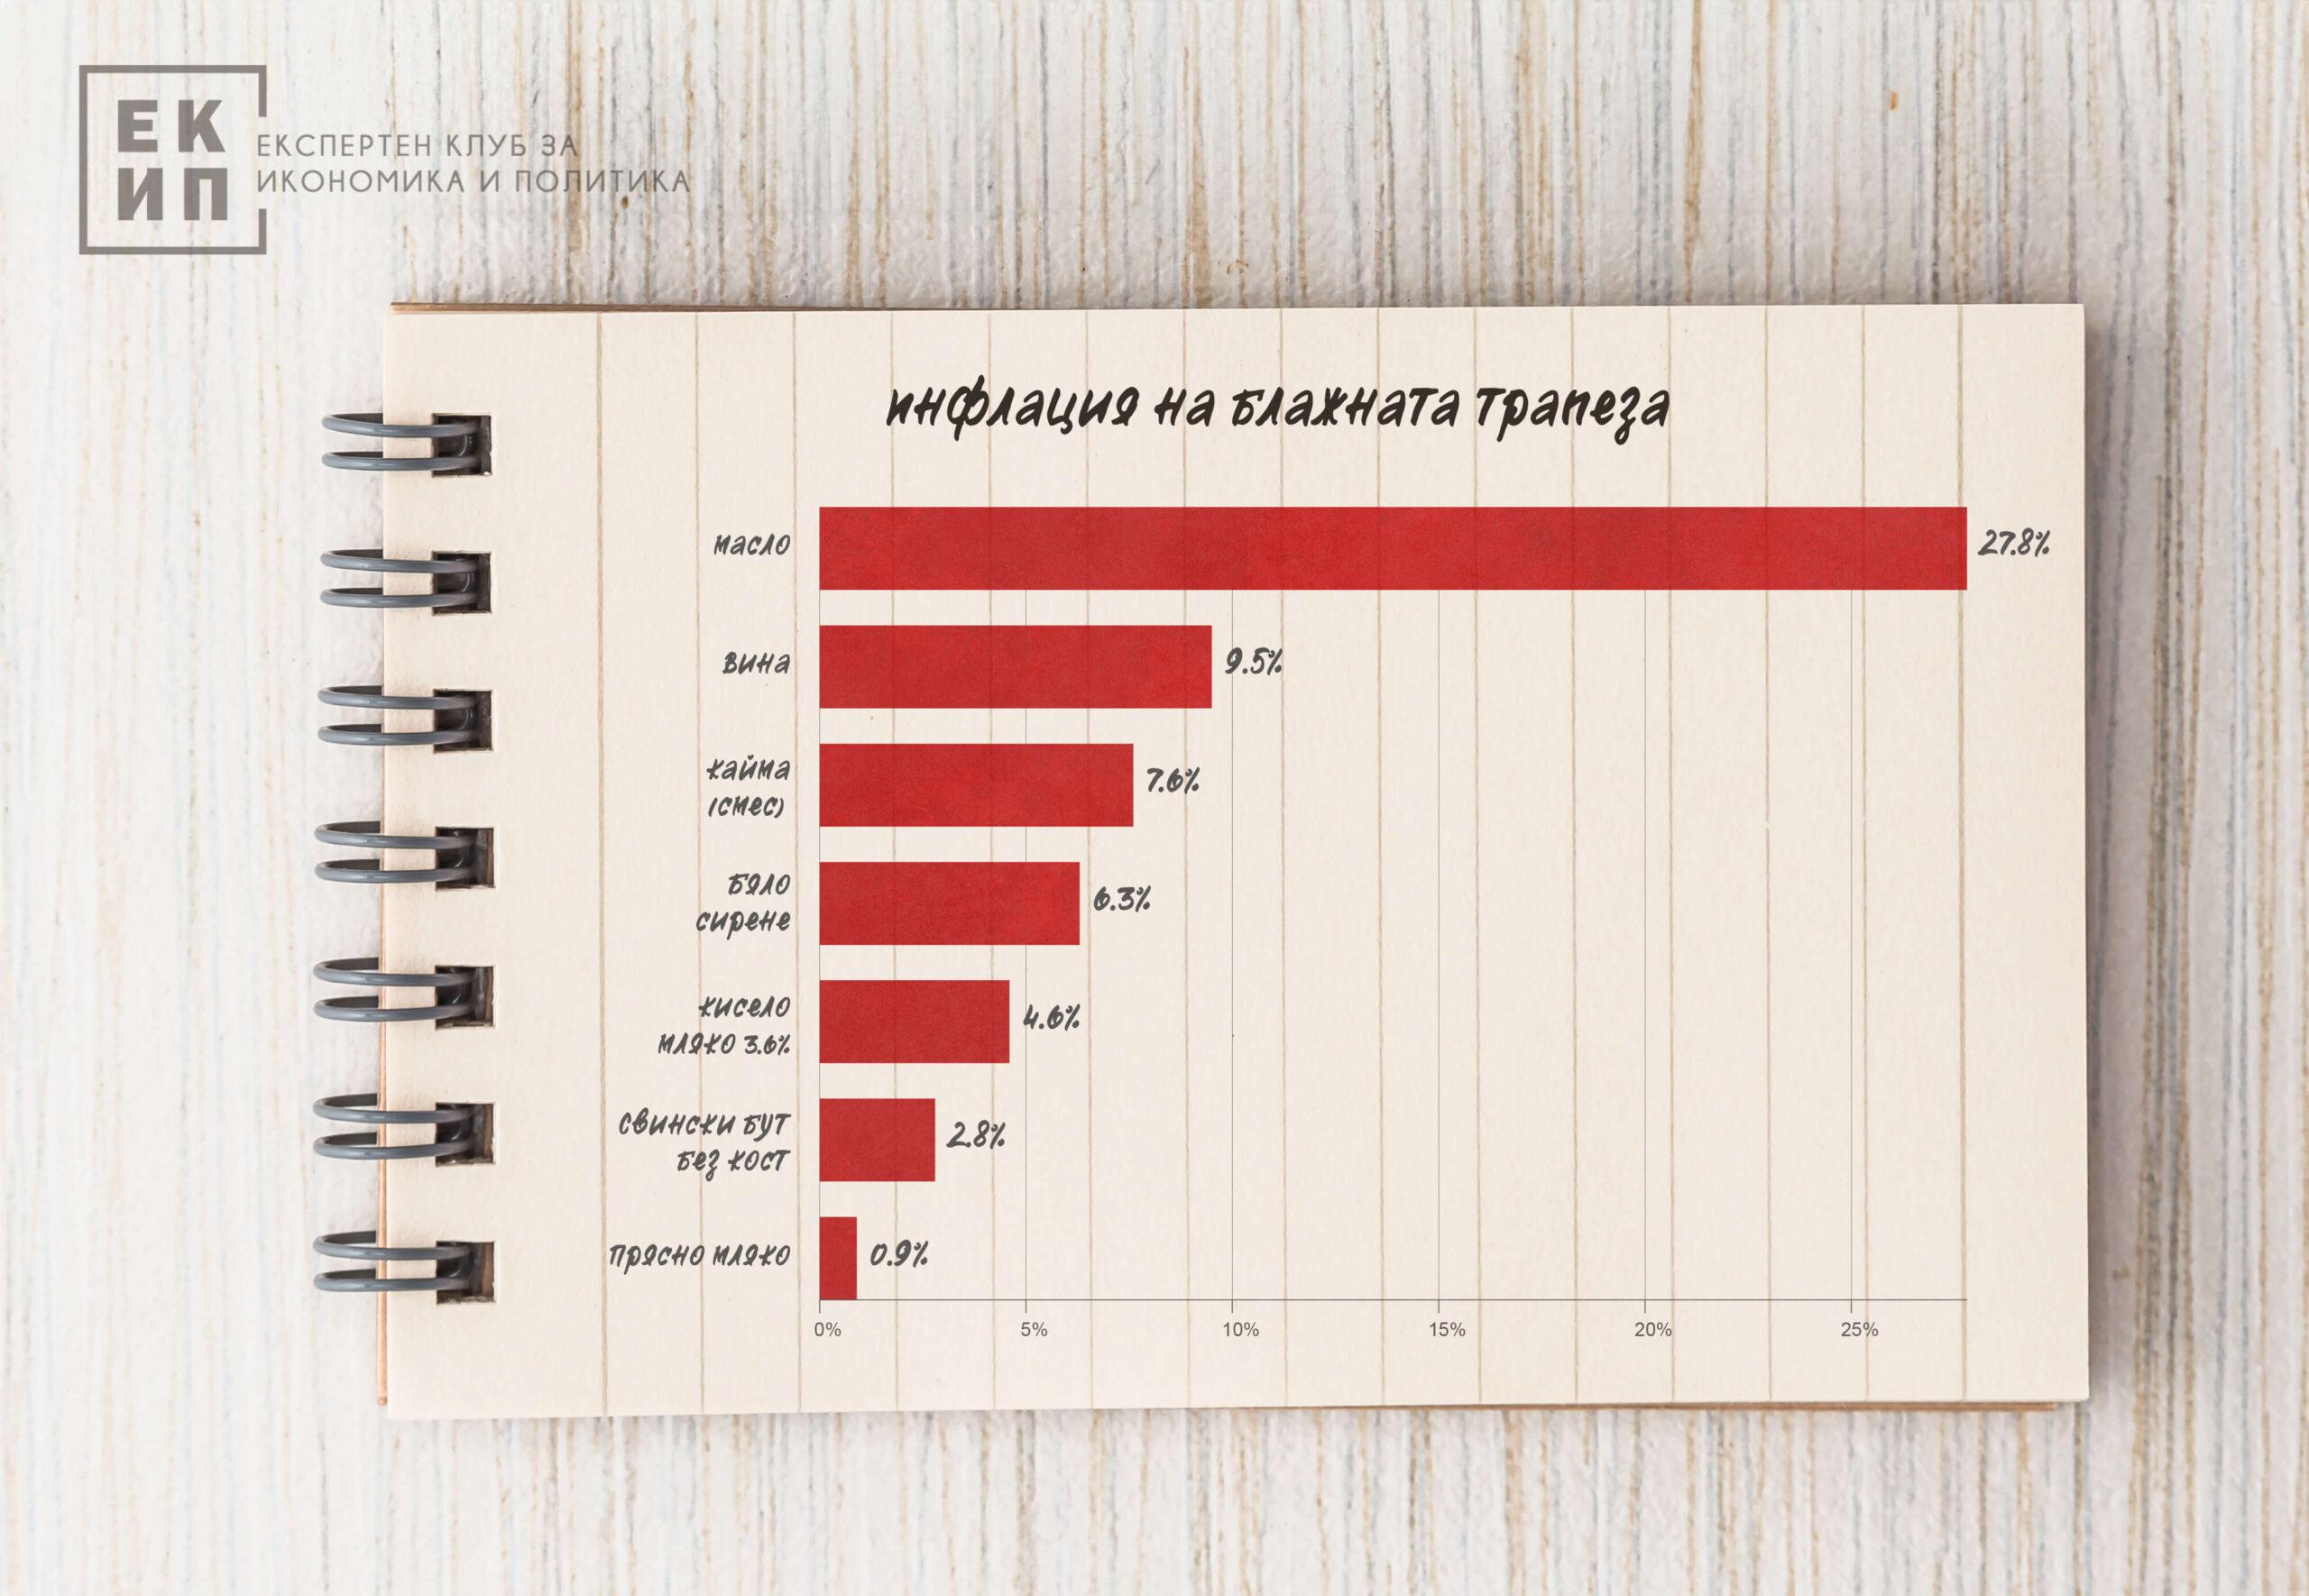
As we noted earlier, butter has the highest inflation rate, and it is important to note that no other soft food product is reporting a double-digit inflation rate. If we exclude butter, the total increase in soft food prices is 3.97%. This is a more moderate increase, but still relatively strong and higher than the overall level of consumer inflation. Products such as minced meat (mixture) and white cheese are reporting inflation of 7.56% and 6.34%, respectively. Wine prices are growing by 9.46% on an annual basis. These products are reporting the highest inflation rates after butter.
Conclusion
Inflation related to the holiday table in Bulgaria reflects both global and local economic movements. For this year's holidays, inflation is far more noticeable in the sweet products - animal food products and wines. On the other hand, for lean products, with the exception of tomatoes and rice, inflation is noticeable, but more moderate. The data shows a normalization of price movements in Bulgaria compared to 2022 and 2023, but not a correction. That is, inflation is stabilizing, but the accumulated price increases over the past few years remain. There are no signs of significant corrective deflation and, although far more moderate, inflation on this year's Christmas table remains noticeable.